
The alternating current I in an inductor is observed to vary with time t as shown in the graph for a cycle.
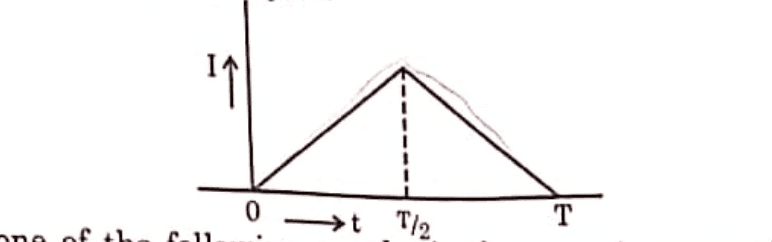
Which one of the following graphs is the correct representation of wave form of voltage V with time t ?
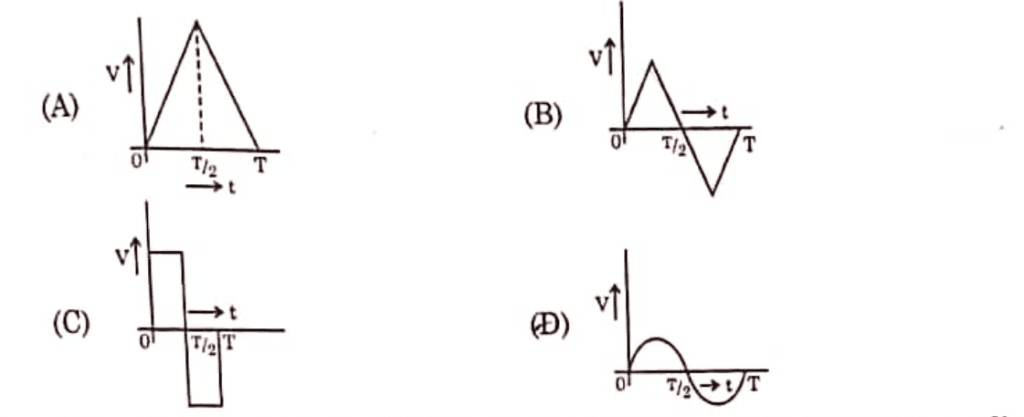
Correct Answer : Option (B)
Watch full Solution of this Question Paper : Click Here
